Independent / It's gettin hot out here datavisualization

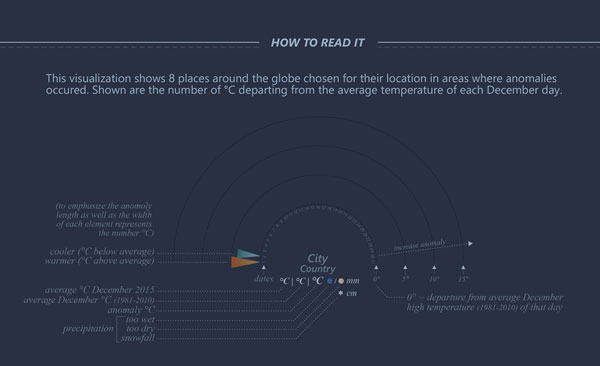
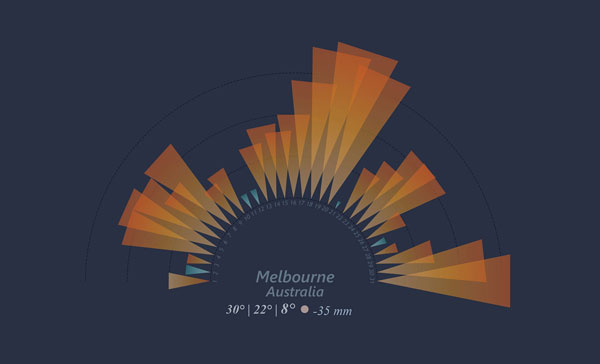
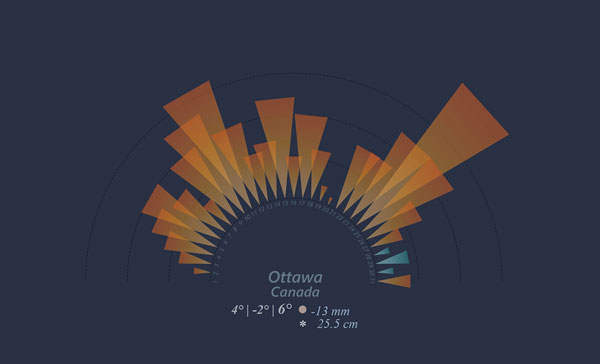
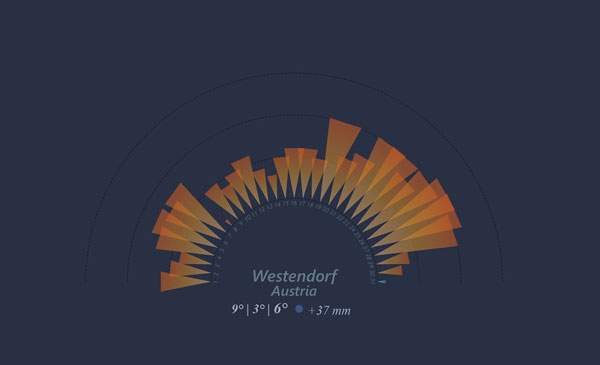
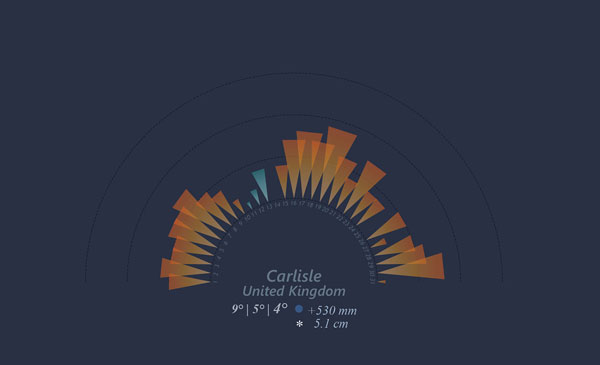
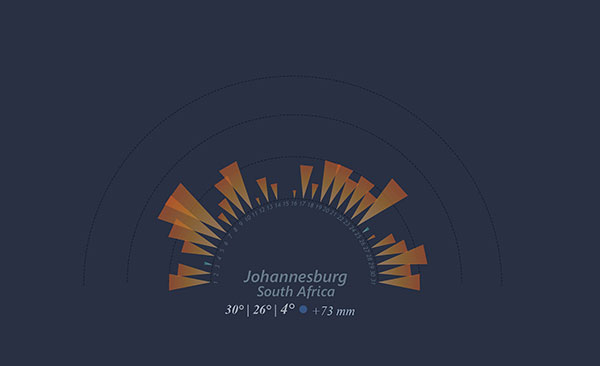
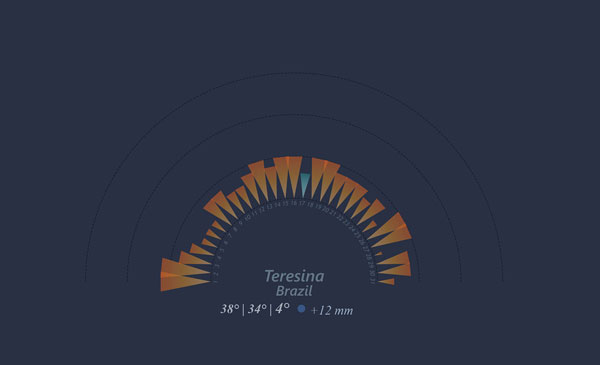
The weather and the changes of it the last year(s) keeps on fascinating me thus I created another weather/climate visualization: it shows 8 places around the globe chosen for their location in areas where anomalies occurred. Shown are the number of °C departing from the average temperature of each December day.
Across the globe, record warm temperatures were observed over every continent, including a large swath of eastern North America, southern Mexico through northern South America, western and central Europe, most of southern Africa, parts of central and southeastern Asia, and a large section of southeastern Australia.

click the swatches to download this color-theme at Adobe Color CC